


Summary
Experiment with the Electrostatic Sprayer
(translation)
Master thesis from Johannes Wendel (2017)
Translated by Zupan d.o.o., for internal and commercial use.
Justus-Liebig-Universität Gießen
Fachbereich 09 Agrarwissenschaften, Ökotrophologie und Umweltmanagement
&
Hochschule Geisenheim University
Master thesis
Analytic Evaluation of New Plant Protection
Application Methods in Fruit Growing
Supervisor: Prof. Dr. Hans-Peter Schwarz,
Institut für Technik der Hochschule Geisenheim University
Advisors: Dr. Karl Wettich,
Landwirtschaftlich Lehr- und Forschungseinrichtung (LFE)
Gießen, Justus-Liebig-Universität Gießen
Supervised also by: Dr. Rainer Keicher und Dipl. Ing. David Brunner,
Institut für Technik der Hochschule Geisenheim University
Submitted from: B. Sc. Johannes Stephan Wendel,
In der Nonnenhecke 5, 67098 Bad Dürkheim
Bad Dürkheim, 15. Mai 2017
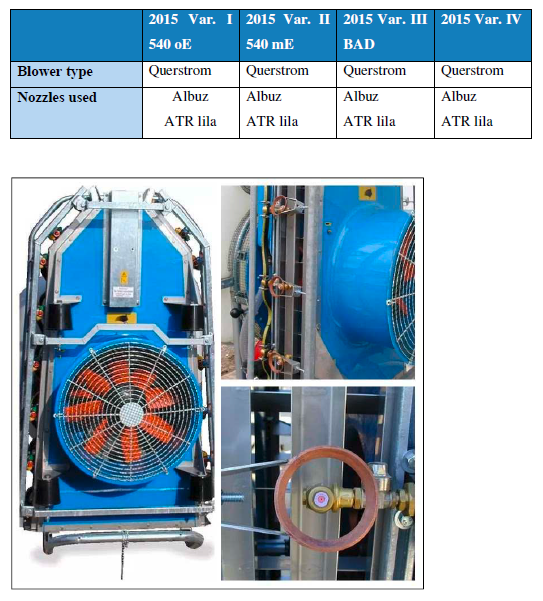
3.1.4 Sprayer with electrostatics "ZUPAN"
The sprayer with the electrostatic system from the company ZUPAN d.o.o. (ZUPAN d.o.o., Malečnik) was used in the Experiment »2015«, series I 540 oE, II 540 mE, III BAD, IV. The exact configuration and build of the machine is to the author unknown. The electrostatic charging technique used is explained in the appendix (8.7 Fundamentals - Electrostatic process - yellow marking).
Table 4 technical information of the DT with Electrostatic
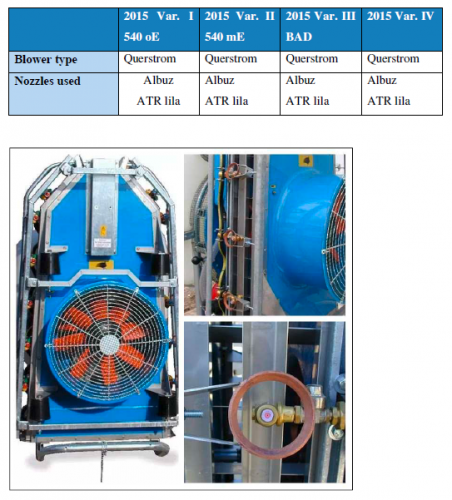
Picture 11 Sprayer (device used may differ) with electrostatic charge of the drops - left: rear view; top right: nozzles with rings; bottom right: nozzle with ring frontal, (ZUPAN d.o.o. b, 2015)
3.2 Experimental plots
The trial consisted from fruit trees (apple, varieties: Elstar and Jonagold) with a row spacing of 3.25m and the tree height of about 2.5m. The cultivation system was the narrow spindle (Schlanke Spindel). All plants were without a hail net. The experiments were carried out after the harvest, the trees were all full of leaves.
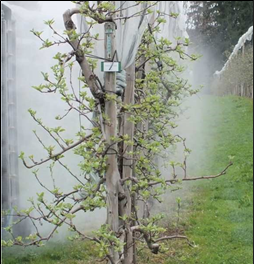
Picture 12: Fruit tree plant with rolled-up hail protection nets during application with PPP (Knaus, 2015)
3.3 Sampling
This section explains the method of sampling. The basis for the sampling is the method preferred by Koch and Knewitz for orchards. Koch and Knewitz proposed a sampling method for orchards, which allowed "to measure the coverage on individual leaves and to estimate their variability and moreover, to provide an image of the spatial distribution in the tree", (Koch & Knewitz, 2006), P. 6). In the case of this work, the coverage is not analysed with this method, but the percentage covered with pesticide and the percentage risk area with different active coronas (Wirkkoronen) around the pesticide drop. Values for the number and the size of the drops are also collected.
For each variant there are three repetitions of the 4 tree crown sectors "A", "B", "C" and "D", distributed over the crown height, with ten leaves on each (Triloff P. b., 2011) (see picture 13).
The crown sectors are located in the following zones on the tree:
A) Deciduous zone that overlaps with the adjacent tree
B) Outer deciduous zone on the right side of a row
C) Inner deciduous zone, close to the trunk
D) Outer deciduous zone on the left side of a row (Koch & Knewitz, 2006).
"In each crown sector, starting from the highest position in the tree (position no. 1) at about 2.5 m height to the lowest branches (sheet no. 10) at about 0.5 m at intervals of approx. 25 cm, one leaf is taken from the petiole and placed in the paper bag marked with the respective code (variant, crown sector, repetition, leaf position) ", (Triloff P. b., 2011, p. 171)
The spray coating must first be dried. Next, the paper bags come in plastic bags and then into a sealable carton to minimize degradation of the photosensitive fluorescent dye (Triloff P. b., 2011).
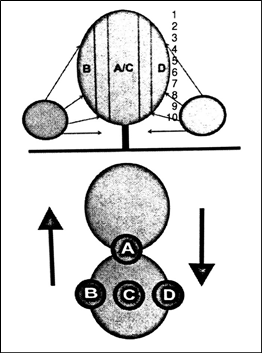
Picture 13: Scheme for the removal of leaf samples with positions according to Schmidt and Koch (1995), modified by Triloff (2011, p. 170)
For sampling, real plant leaves on the tree were used, as these reflect the real distribution characteristics of pesticides on the target area, compared to artificial collectors, which would have to be hung up separately in the test plots (Koch & Knewitz, 2006).
The data obtained can provide information about the average coverage [%], the variations in coverage and the distribution in the foliage. The same applies to the data of the risk areas and to the number and size of the drops.
3.4 Leaf coverage
The pesticide-like leaf covering was produced with a water and fluorescent dye mixture. The fluorescent dye used in the experiments was the product Tinopal® NFW (Ciba Lampertheim GmbH, Chemiestraße, DE-68623 Lampertheim) with an active substance content of 20 g * 100 g-1 (Triloff P.b., 2011, p. 168).
In the "2015" series of experiments, the concentration of the active substance (disodium-2,2 '- ([1,1'-biphenyl] -4,4'-diyldivinylene) bis (benzenesulfonate)) was 25%. The application rate in the experiments was 300 ml / 100 l.
3.5 Evaluation method and software
The following section explains the two different evaluation methods with different software. Special experimental images of plant leaves with pesticide-like coating (water with fluorescent dye) were evaluated. The experimental images were taken under UV lights and a camera mounted on a tripod. With the method »Buchholz & Vornhagen« the covering of the upper and lower side of the leaves was analysed, with the »Brunner« method only the surface of the upper side of the leaf was examined. Simplified, the coverage quality of plant protection products is examined on the respective leaf sides by means of various parameters.
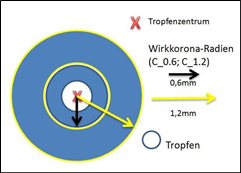
Drop area [cm²], pots number, drop per cm², average drop size [mm²], coverage [%], risk area [%] Corona (0.6 mm, 1.2 mm, 1.8 mm) and risk area [cm²] (0.6 mm, 1.2 mm, 1.8 mm) each for the corresponding threshold.

Picture 26: Schematic representation of the »active corona«
3.6 Rating
The image analytical assessment of new plant protection application methods in orchards, with regard to the coverage quality of PPP on the leaves, is a comparative assessment of the various spray devices and their technical modifications and settings, which are reflected in the different variants.
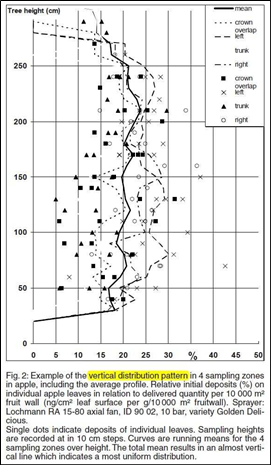
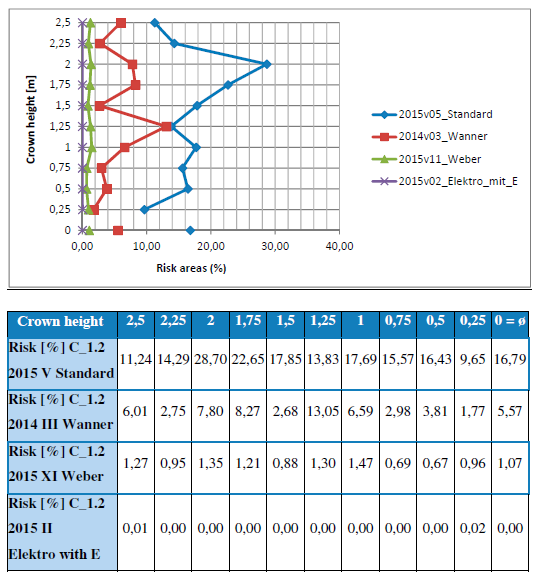
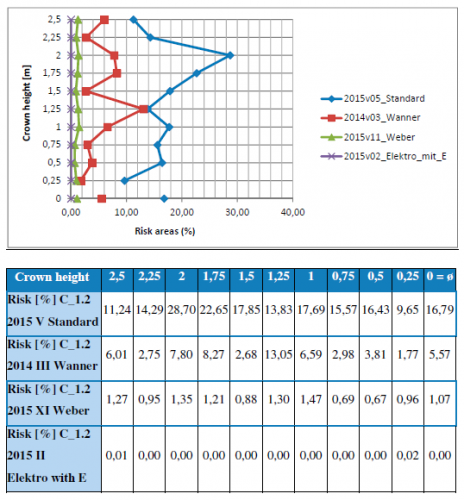
We rated the coverage of the leaf areas by zones, the covering of the leaf areas above the crown height and the risk area of the leaf surfaces above the crown height. The risk area data is based on values of the »active corona«, a pesticide drop around its centre, of 0.6 mm, 1.2 mm and 1.8 mm. As a basis, the averages of a variant were used. In detail there is graphics modelled on Koch and Knewitz (see Picture 27).
Finally, a "best of" table is created with the best variants of the various devices for the lowest risk area.

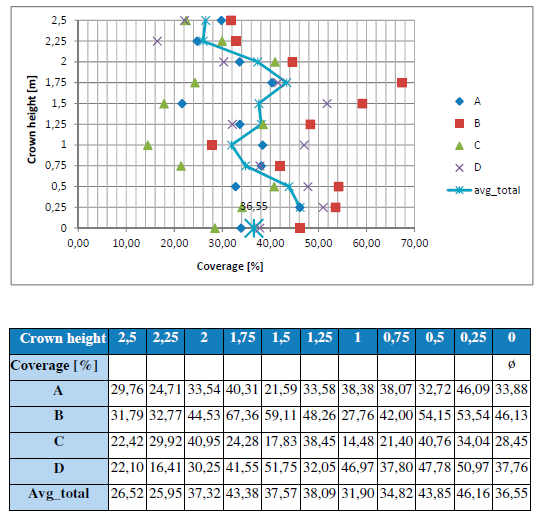
Picture 27: Example of a vertical distribution pattern in four sample zones of an apple tree including average coating (Koch & Knewitz, 2006, p. 8)
4 Results
4.2.2.1 "Electrostatic" device (variants I oE and II mE)
Percentage coverage by zone
Table 21 "Electrostatic" device (variants I oE and II mE) - Percentage coverage by zone
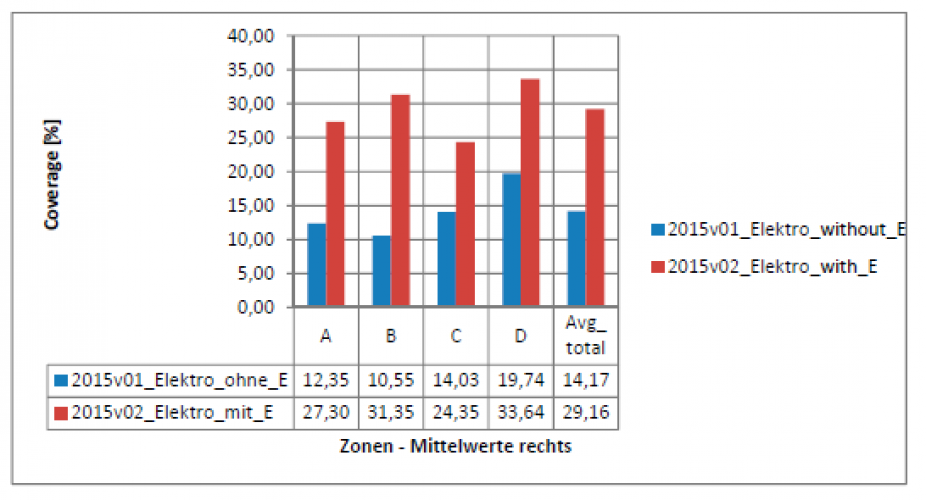
The "electrostatic" device in variants I and II has a similar distribution of coverage over the zones. In both, Zone D is covered the most. The total coverage in Variant II with the electrostatic charge switched on is significantly greater than Variant I without charging. The variation coefficients for variant I are 28.08% and 14.21% for variant II.
Percentage of coverage over the crown height
Table 22: "Electrostatic" device (Variations I oE and II mE) - Percentage coverage over the crown height
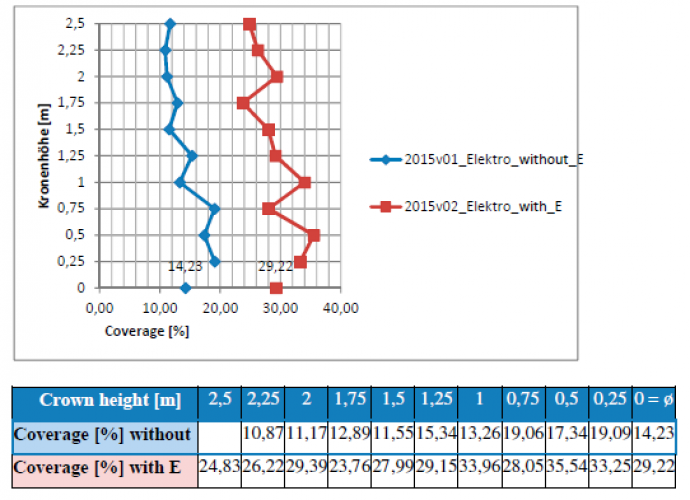
Here, the variant II proves to have the thicker cover. The total value for variant II is 29.22%, in contrast to variant I with 14.23%. At both variants the coverings are distributed similarly over the crown height. The coefficients of variation are 22.82% for Variant I and 13.48% for Variant II. In this case Variant II is the better of the two.
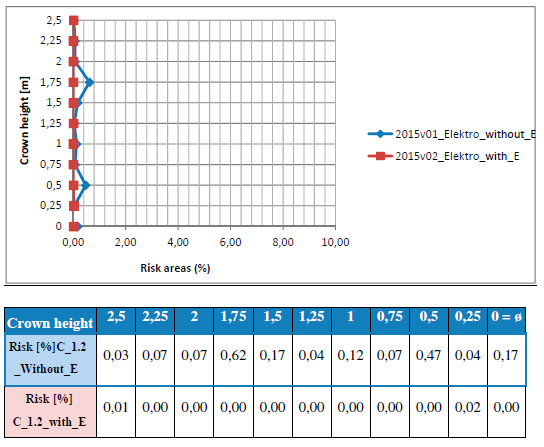
Percent size of the risk areas with »active corona« of 0.6 mm
Table 23: "Electrostatic" device (Variations I oE and II mE) - Percentage size of the risk areas with »active corona« of 0.6 mm
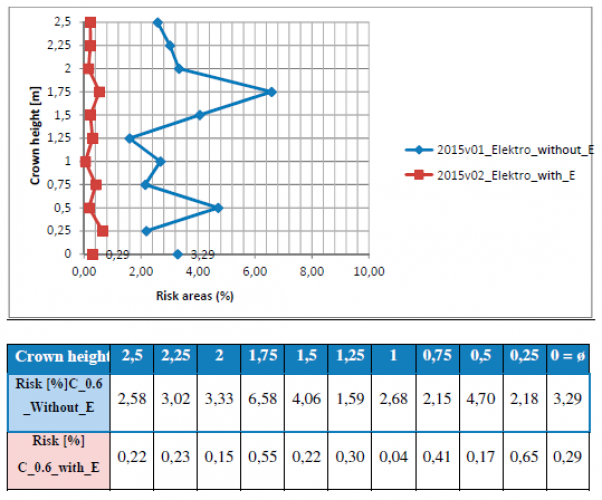
With regard to the size of the risk area with an »active corona« of 0.6 mm, both variants have low values. Variant II has less risk areas (0.29%) than Variant I with 3.29%. The standard deviation is 0.19 for Variant II and 1.48 for Variant I.
Percent size of the risk areas with »active corona« of 1.2 mm
Table 24: "Electrostatic" device (Variations I oE and II mE) - Percentage size of the risk areas with »active corona« of 1.2 mm
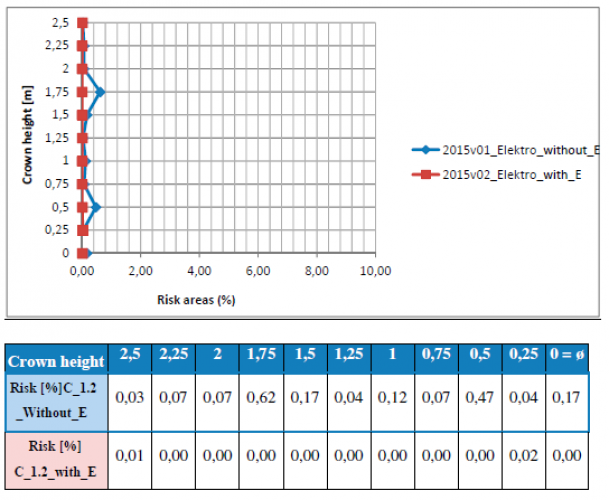
With the size of the »active corona« of 1.2 mm, there are almost no differences anymore. Both variants have risk areas close to zero percent. Their standard deviations are also almost zero.
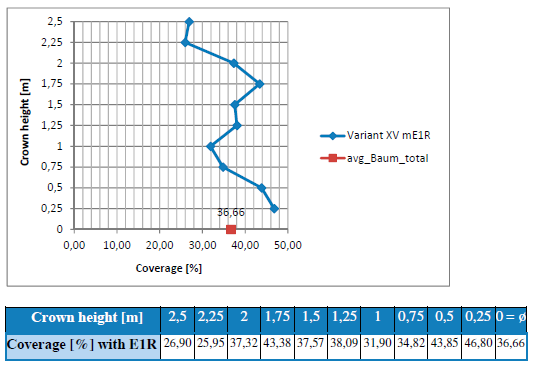
4.2.2.2 "Electrostatic" device (variant XV mE1R)
The variant XV mE1R differs from the other variants of the "electrostatics" device in that according to Triloff (personal comment, 2017) »[...] only one row of left and right were treated. This should be excluded in treatments with full fan speed, the influence of the treatment of neighbouring rows by the excessive fan speed«.
Percentage coverage by zones
Table 25: "Electrostatic" device (variant XV mE1R) - Percentage coverage by zone
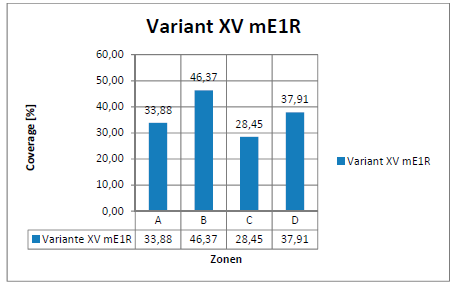
Variant XV has a relatively similar distribution of the deposit over the zones. Here the BOS are covered the most, followed by Zone D. The coefficient of variation is 20.59%.
Percentage coverage over the crown height
Table 26: "Electrostatic" device (variant XV mE1R) - Percentage coverage over the crown height

The total coverage for variant XV is 36.66%. The values deviate a maximum of about 10 percentage points from the middle value in both directions. The coefficient of variation is 19.05%.
Percentage coverage over the crown height and zone
Table 27: "Electrostatic" device (variant XV mE1R) - Percentage coverage over the crown height and zones (A, B, C, D)

Here it can be seen that the coverage values of the BOS of the zones varies widely over the crown height. In the upper third zone B reaches the highest value across all zones.
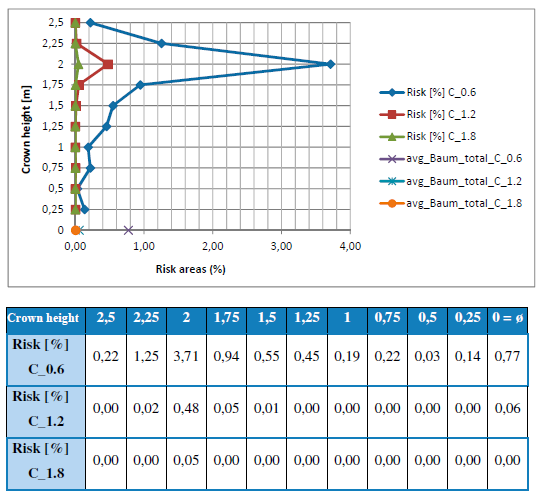
Percentage size of risk areas
Table 28: "Electrostatic" device (variant mE1R) - Percent size of risk areas

The risk areas are close to zero for all »active coronas«. The risk area here at C_0.6 is 0.77% and is further reduced by a factor close to 13 to a value of 0.06% at C_1.2. An »active corona« of C_1.8 no longer has any risk areas.
4.2.3 »Best of« from all series of experiments and equipment in terms of the size of the risk area (lowest mean values)
To assess all variants according to the best of their equipment, the lowest average risk area was used as the benchmark. It should be noted that the "electrostatic" device and the "Wanner Praxis" device applied coating on both sides and all other devices on one side.
Percent size of the risk areas with effective corona of 0.6 mm
Table 41: "Best of" - Percent size of risk area - Corona = 0.6 mm
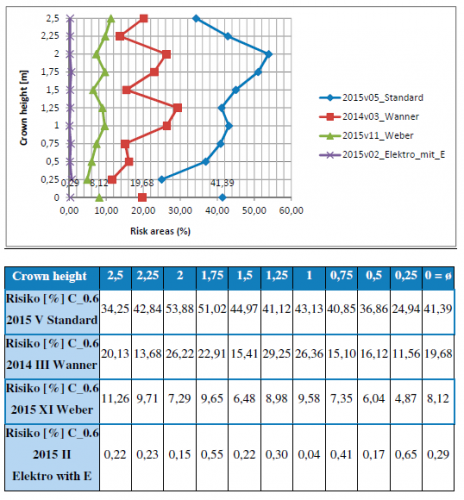
The best result in comparison with all variants is provided by the variant 2015 II "Elektro". This variant delivers the smallest risk areas on the upper side of the sheet. The best variant of the "Weber prototype" generates the second best in the "Best of" comparison of the size of the risk area. The best variant (variant 2014 III "Wanner") of the "Wanner Prototype" has an approximately 20 percentage points larger risk area (active corona C = 0.6 mm) as the variant 2015 II "Elektro". The best variant of the "Wanner Praxis" device (variant 2015 V "Wanner Praxis") has a result that is about 53 percentage points worse. With regard to the distribution of the risk areas on the BOS above the crown height, the variants 2015 II "Elektro" and Variante 2015 XI "Weber" produce even images. The other two scatter more.
Percent size of the risk areas with »active corona« of 1.2 mm
Table 42: "Best of" - Percent size of the risk area - Corona = 1.2 mm
4.2.4 Comparison of the "best of" variants
Table 43 below lists the "best of" variants and their data. The variant 2015 II "Electro" has the lowest risk areas, but applied on both sides in the experiment. Therefore, the variant 2015 XI "Weber prototype" was chosen as the benchmark.
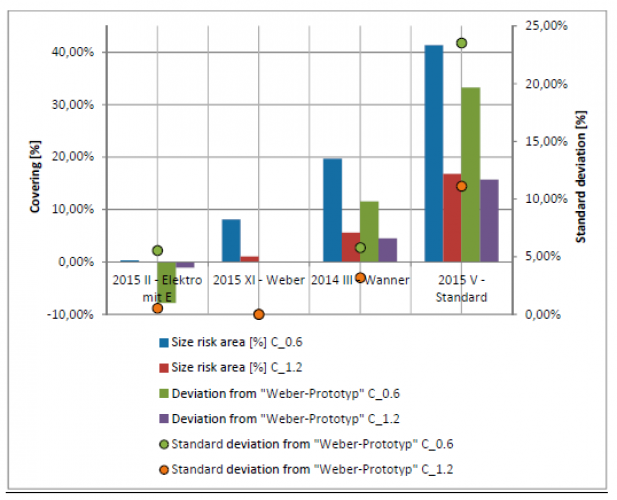
Table 38: Comparison chart of the "best of" variants AND comparison with variant 2015 XI "WeberPrototype"
Variant 2015 II "Electro" has an approx. eight percentage point lower risk area, Variant 2014 III "Wanner" approx. 12 percentage points larger and Variant 2015 V "Wanner practice" a risk area approx. 33 percentage points larger than the comparison (Variant 2015 XI "Weber- Prototype ") (effective corona C = 0.6 mm). With respect to the effective corona of C = 1.2 mm, the differences become smaller for comparison. Variant 2015 II "Elektro" is about one percentage point better, variant 2014 III "Wanner" 4.5 percentage points worse and 2015 V "Wanner practice" 16 percentage points worse.
6 Summary
In this Master Thesis new crop protection application methods analysis in fruit trees were evaluated. The work provides interesting results for improving the application of pesticides in fruit growing. All in all, it can be said that the prototypes are better at applying pesticides to the top of the leaves than the Praxis device. The different technical changes on the equipment (for example: distance between the nozzle stations and air outlet stations, selection and number of nozzles, use of electrostatic charge of the drops) as well as the external changes (driving speed and application method) are reflected in the result. When applying PPP in orchards, there is usually an overcrowding of the underside of the leaves and a less good occupancy of the leaf top. Just above the top, one of the main pests in orchards (spores of apple scab, Venturia inaequalis, Cooke, Winter) infests the leaves (Triloff P. b., 2011). With the new crop protection application methods of prototypes and an electrostatics device analysed here, this problem can be solved.
The best result in comparison among all variants is provided by the variant 2015 II "Electric". This variant delivers the smallest risk areas on the upper side of the sheet. The device used here is the spraying device from Zupan (ZUPAN d.o.o. a, Malečnik) with the electrostatics switched ON. Note, however, that the application made with this device was from both sides. The best variant of the "Weber prototype" (Weber, Bodman Mechanical Workshop) generates the second-best size of the risk area in the "Best of" comparison. The pesticide was applied with this device only half-sided.
The analysis of the photographs of the covered plant leaves of fruit trees came from Brunner (Institute of Technology of the University Geisenheim University) - a new program, based on the image processing program OpenCV. The greatest advancement of the analysis program is that the values of the risk areas (leaf areas with insufficient coverage with PPP) are not average values over the average number of drops and droplets size including corona, but the actual risk area is determined. Thus, further experiments at the University Geisenheim University will be examined with this program.

Graz University of Technology - Experimental and Research Institute for High Voltage Technology
BASICS - ELECTROSTATIC PROCEDURE
General
The use of the electrostatic method makes it possible to spray electrostatic charged drops of spray. Thus, in addition to the purely mechanical forces due to the pressure of the spray liquid and the carrier air flow of the blower, the droplets also experience the effects of the electrical force which are effective both between the droplets and above all between the charged droplets and the plants targeted. This way we can achieve a more intensive application of the spraying agent on the targeted area – while making a saving on the spraying agent at the same time. Basically, the following electrostatic processes are available for charging spraying liquids in chemical crop protection:
Direct charging
Contact charging
Non-contact charging (Post-atomization charging)
The methods differ both physically regarding the charging mechanisms, as well as in terms of their application options on blower spraying and surface spraying (field spraying).
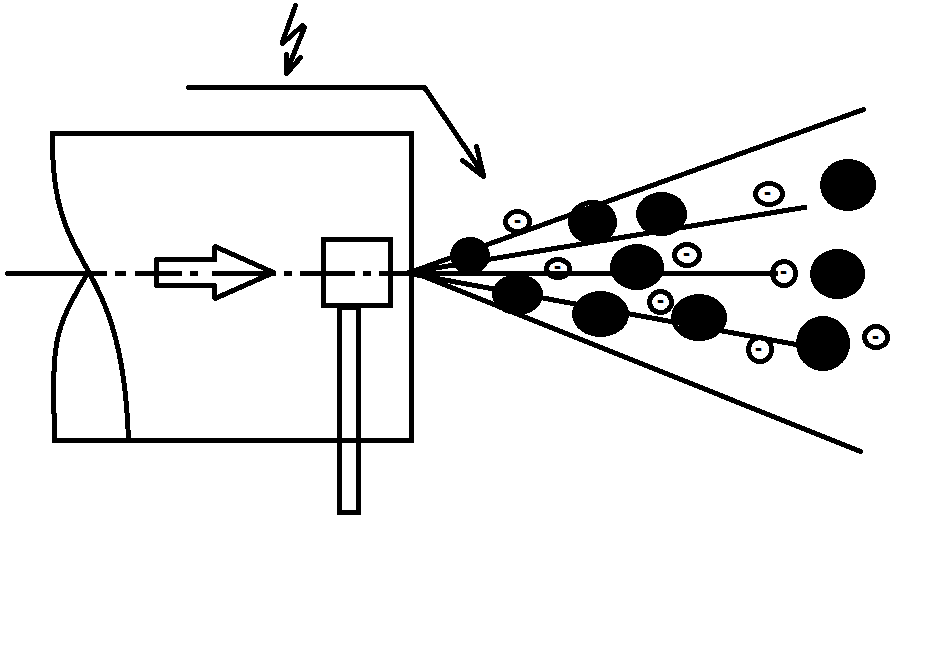
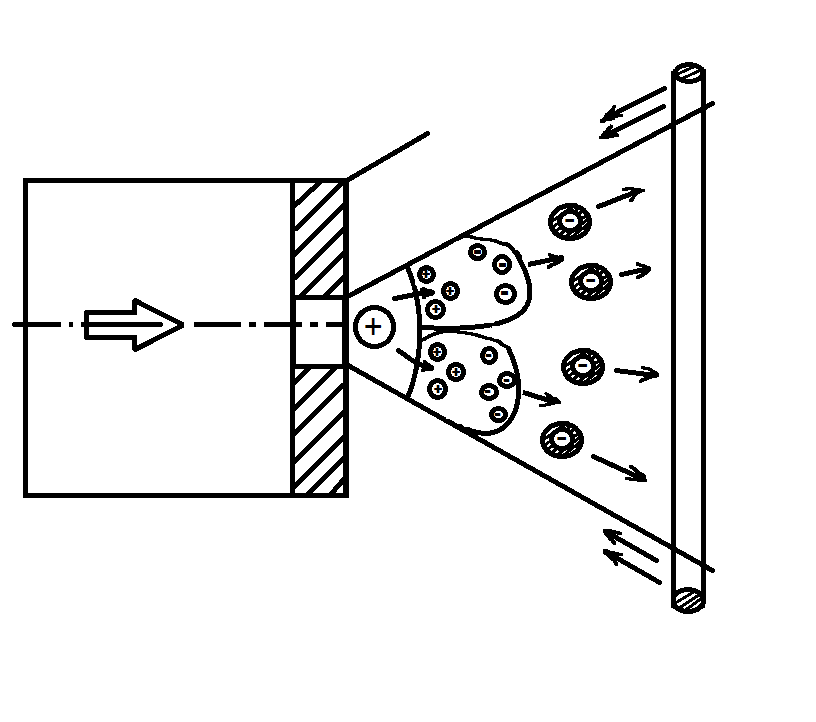
Direct charging
In direct charging, as shown in Figure 1, a spray electrode is brought in the immediate vicinity of the sprayed liquid. The spray electrode is connected to high voltage, which causes it to spray in front of the electrode (corona), and depending on the polarity of the applied high voltage positive or negative charge carriers diffuse into the spray.
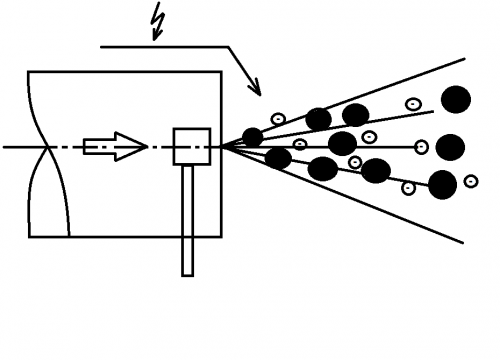
Characteristic of this type of charging is that the sprayer and the liquid tank remain grounded and only the spray electrode near the nozzle is at high voltage. However, it requires the triggering of the corona discharge at the electrode of a very high voltage, also optimal efficiency cannot be achieved because of the stray currents occurring with the high voltage system.
Contact charging
The contact charging is based on Figure 2, the principle being that the liquid to be sprayed is at high voltage potential, and at the exit point from the nozzle by the forces of the external field, a charge separation in the liquid occurs.
The demolition process produces unipolar charged droplets. Characteristic of this type of charging is that the entire fluid system is at high voltage and requires considerable effort to complete isolation of the system, or the electrical separation between the tank and nozzle must be made by correspondingly long plastic leads. With the method, a good efficiency of the high voltage system is achieved. However, in practice there are problems with the different potential capabilities.
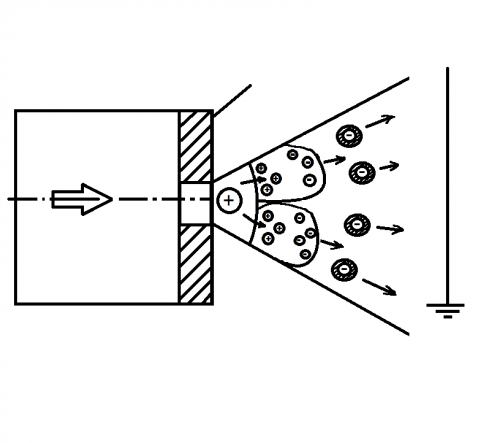
Non-contact charging (Post-atomization charging)
In the non-contact charging method an electric field is established by appropriate measures in the immediate vicinity of the spray nozzle, which causes a separation of charges in the spray liquid. The demolition process produces unipolar charged droplets.

In this type of charging method, the entire liquid system is at ground potential, only the so-called "potential ring" which builds up the electric field in front of the nozzle and the high voltage supply from the sprayer to the ring must be appropriately insulated. With this method, a very high efficiency of the high voltage system is achieved.
Dec 19, 2017